
Hydroclimatology
How does global warming affect the hydrological cycle?
Global warming directly affects water in the atmosphere and on land. An intensification of evaporation lifts moisture from the surface to the atmosphere where clouds grow larger and lead to increasing total precipitation. Even though the global precipitation rate is increasing, the local and intra-seasonal impacts vary and both floods and droughts tend to exacerbate.
The effects of global warming depend on both time and space scales. As an example, local scale precipitation can intensify at a much larger rate than larger scale precipitation systems, and changes in extremes can be opposite in sign to the change in the mean climate. This makes studies of the hydrologic cycle both interesting and challenging.
Hydroclimatology is the study of the intersection between water in the atmosphere and on land. The exchange of water can greatly affect both the local and global climate.
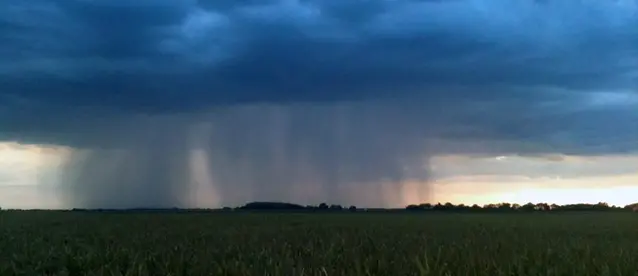
A heavy downpour with potential for large impacts.
Robustly connecting climate models and hydrological models
Hydrological models require high quality meteorological forcing data. We are developing the observationally based data sets HIPRAD and HydroGFD for historical periods as well as for real time applications. Systematic bias prevents directly forcing hydrological models with climate model data, and an intermediate bias adjustment step is necessary. We develop the MIdAS (MultI-scale bias AdjuStment) method that separately adjusts short and long time scales for a tailored performance and more robust and reliable results.
Hydrometeorological extremes
Extremes are uncertain by nature, and the more uncertain the rarer the extreme. A co-occurrence of single rare extremes can have vast societal consequences, but are very challenging to study. Large data sets together with novel methods for treating the data are needed to increase our understanding in the processes behind extremes, and to assess their societal impacts.
Research and development questions
How to make the best forcing data sets for hydrology?
The HIPRAD and HydroGFD methods makes use of multiple data sets to make a best combined product. New methodologies and products are continuously developed to improve hydrological forecasts and climate impact modelling.
What is current state-of-the-art bias adjustment, and how to improve?
Bias adjustment is routinely performed as part of the climate change impact modelling chain. There is, however, no state-of-the-art or off-the-shelf-product to use. We explore different methods for bias adjustment, the interaction between time and space scales, and methods for proper evaluation of bias adjustment methods. All with the goal of producing the best available knowledge base for hydrological impact assessments.
How will hydroclimatological extremes change in the future?
The hydrologic cycle is intensified in most parts of the world, and we study how wet and dry conditions are affected. In particular, we study multiple extremes with large societal impacts.
Core publications within this scientific focus
Berg, P.; Almén, F. & Bozhinova, D. HydroGFD3.0: a 25 km global near real-time updated precipitation and temperature data set, submitted to ESSD, 2020.
Berg, P.; Christensen, O. B.; Klehmet, K.; Lenderink, G.; Olsson, J.; Teichmann, C.; & Yang, W. (2019). Summertime precipitation extremes in a EURO-CORDEX 0.11 degrees ensemble at an hourly resolution. Natural hazards and earth system sciences, 19(4), 957-971.
Berg, P.; Donnelly, C. & Gustafsson, D. Near-real-time adjusted reanalysis forcing data for hydrology, Hydrology and Earth System Sciences, Copernicus GmbH, 2018, 22, 989-1000.
Berg, P.; Norin, L. & Olsson, J. Creation of a high resolution precipitation data set by merging gridded gauge data and radar observations for Sweden, Journal of Hydrology, 2016, 541, 6-13.
Berg, P.; Haerter, J. O.; THejll, P.; Piani, C.; Hagemann, S. & Christensen, J. H. Seasonal characteristics of the relationship between daily precipitation intensity and surface temperature, Journal of Geophysical Research, 2009, 114, 9 PP.
Berg, P.; Moseley, C. & Haerter, J. Strong increase in convective precipitation in response to higher temperatures, Nature Geosci., 2013, 6(3), 181-185.
Moseley, C.; Berg, P. & Haerter, J. O. Probing the convection life-cycle by iterative rain cell tracking, Journal of Geophysical Research, 2013, 118, 13361-13370.
Moseley, C.; Hohenegger, C.; Berg, P. & Haerter, J. Convective extremes driven by cloud-cloud interaction, Nature Geoscience, 2016, 9, 748-752.
Schmith, T.; Thejll, P.; Berg, P.; Boberg, F.; ... & Madsen, M. S. (2020). Identifying robust bias adjustment methods for extreme precipitation in a pseudo-reality setting. Hydrology and Earth System Sciences Discussions, 1-22.
Yang, W.; Gardelin, M.; Olsson, J.; and Bosshard, T. Multi-variable bias correction: application of forest fire risk in present and future climate in Sweden, Nat. Hazards Earth Syst. Sci., 2017, 15, 2037-2057.