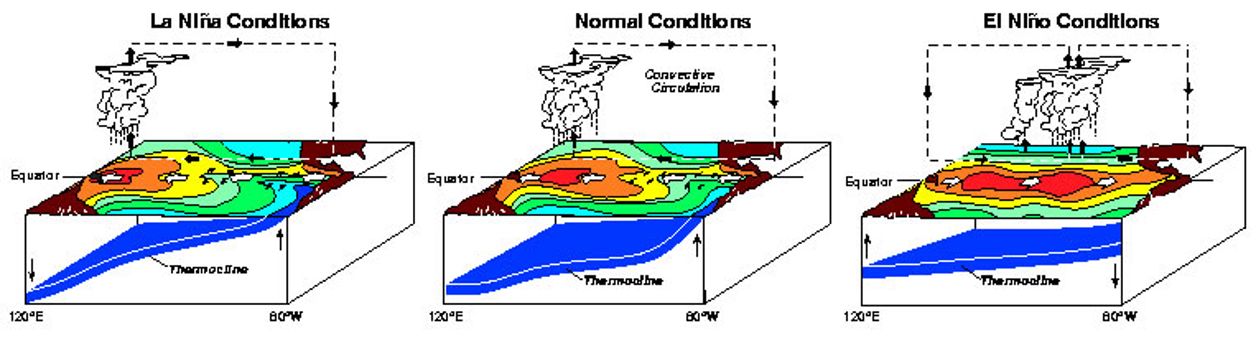
During normal conditions the air rises over Indonesia and Australia, creating large cloud systems with substantial amounts of rain. At a high altitude the air travels eastwards and sinks over South America. The Trade winds transport back the air westwards. Cold, nutrient-rich water upwells along the coast of South America (Figure 1, middle).
El Niño
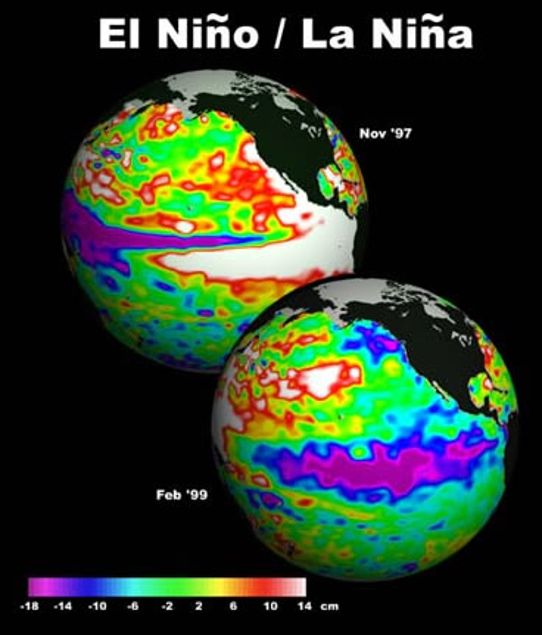
When El Niño occurs, the Trade winds weaken or change direction. The warm surface water is carried eastwards and the cloud system and wet weather follow. The cold, nutrient-rich water, which usually upwells along the coast of South America, is pushed down by a build-up of warm, nutrient-deficient water (Figure 1, right). The water along the west coast of North America is often unusually warm, sometimes as far north as Alaska (Figure 2).
The displacement of the cloud systems to the east during El Niño causes droughts in Indonesia and Australia. The central Pacific suffers heavy rain and hurricanes, which are usually uncommon there.
Along the coast of South America, Ecuador and Peru, which usually have a desert-like climate, receive heavy rain, causing floods and erosion to the otherwise dry landscape. Alaska and Canada experience warmer temperatures than usual.
El Niño returns every 4-7 years and remains for about 12-17 months. The name comes from the fishermen on the coast of Peru. El Niño means “little boy”, or “Christ child” in Spanish, since it is originally referred to the warming of the sea that tended to occur around Christmas time. However the term has come to mean the whole period for which there is a significant increase in sea surface temperature for a larger area of the eastern Pacific.
La Niña
La Niña means “little girl” and occurs on average every 3-5 years. The phenomenon involves a cooling of the sea surface temperature around the Equator in the central and eastern parts of the Pacific (Figure 1, left, and Figure 2).
According to the definition of the American weather service at NOAA, the sea surface temperature has to have an average of at least -0.5 degrees from the normal temperature for 3 months. A fully developed La Niña affects the areas around the tropics and even the northern hemisphere.
As a La Niña event forms, the effects are noticed mostly in the tropics and the southern hemisphere. The monsoon rains over India will be a bit heavier than normal and Australia’s climate will be warmer than usual.
When La Niña is fully developed it still affects the areas around the tropics, but at higher latitudes, and winter in the northern hemisphere is affected. The area around Indonesia will be wetter than usual and the areas of low pressure in the Gulf of Alaska will be weaker than usual.
Alaska and Canada will have colder weather than usual while south eastern parts of USA will be warmer and dryer. Europe and the Nordic countries are hardly affected by La Niña and El Niño.
There are still a lot of questions surrounding these two weather phenomena and research is ongoing.
Examples of significant El Niño and La Niña
El Niño and El Niña are part of the system that is usually referred to as ENSO (El Niño/Southern Oscillation), where “El Niño” characterises what happens in the ocean and “Southern Oscillation” describes the atmospheric part.
The warm phase of ENSO is linked to El Niño while the El Niña prevails during the cold phase. Several types of index are used to define the different phases and provide a measure of the strength.
The diagram in Figure 3 shows how the MEI (Multivariate ENSO index – an index based on several variables) varies during the period 1950–2010. Positive values (red) show El Niño periods while negative values (blue) show La Niña periods.
The MEI index has to reach over 1.4 to count as a significant El Niño and for La Niña it has to drop below -1.2. Figure 3 shows a very strong El Niño in 1982/83 and also in 1997/98. Longer periods with La Niña conditions were experienced in 1954.56 and 1973-76.
Observation systems
When the strong El Niño event occurred in 1982-83, nobody was prepared for it, partly due to a lack of real-time observations, and the consequences were costly.
An extensive measurement programme called TAO (Tropical Atmosphere – Ocean) started in the mid-80s in order to follow the developments around the equator in the Pacific and therefore be able to tell when an El Niño or La Niña is forming.
After ten years the measurement system was completed and now has almost 70 buoys (Figure 4). These send data in real time about the sea temperature down to 500 m together with different significant meteorological parameters (Figure 5). Some locations also measure currents.
Altimeter measurements from satellites are also very useful for observing changes in the sea surface of the Pacific (Figure 2). Warm surface water is linked to higher sea levels, which can used to follow the development of the pool of warm water.
Climate change
El Niño and La Niña have a significant effect on the global climate. They can cause regional droughts and heavy rain, as well as both unusually low and unusually high temperatures.
The stronger greenhouse effect could lead to a change in the balance of the climate system which in turn could change the distribution between various naturally-occurring climate oscillations.
For example the El Niño oscillations in the Pacific could change so that the El Niño maxima become stronger. This would affect the average climate values but in particular the extreme values.
So far these are just speculations and there is still not enough known about the climate system to decide why and by how much these types of oscillations could change.