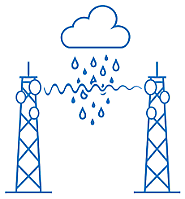
Using microwave links to monitor rainfall
Microwave links constitute an important part of the backhaul network in telecommunication networks. The commercial microwave links (CML) essentially transmit a microwave signal between two telecommunication tower locations through the lower atmosphere. Rainfall attenuates the signal, and the attenuation is proportional to rainfall intensity. This provides an opportunity to monitor rainfall – and potentially also other variables – using such networks.
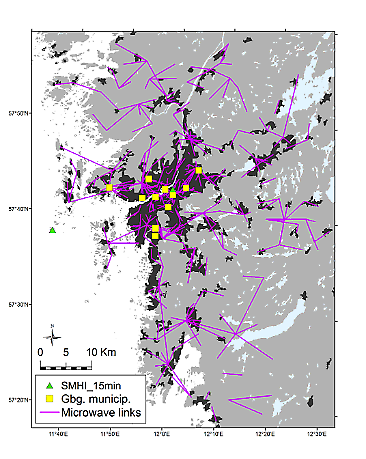
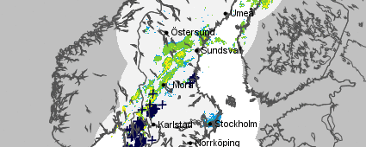
Monitoring rainfall with microwave links can have several advantages. The large number of links provide opportunity for monitoring at many more locations, particularly in cities and in areas with limited radar coverage. The operational nature of the networks enables monitoring at very high temporal resolution and in near real time. From this, more detailed rainfall maps can be created to depict ongoing rainfall, as visualized above.