SMHI presented a comprehensive report with climate statistics for all of IKEA’s current and potential market regions. Relevant climate statistics were used to recommend how to split the world into different zones with similar climates. IKEA will use the report to develop products that are resilient to the world’s different climate zones. The primary parameters considered were temperature and humidity.
World maps showing global temperature conditions
A selection of cities was used to represent IKEA’s current market, and for those regions identified for potential expansion. Representative weather stations were selected for each city and used in the analysis. Climate statistics were presented in the report using both maps and diagrams for each city.
During the process of identifying climate conditions for IKEA’s market regions, meteorological data from a large number of monitoring stations were used.
Global maps were created to show relationships between temperature and humidity, alongside diagrams showing the minimum, maximum and average values. The diagrams showed both the yearly and daily cycles for each variable.
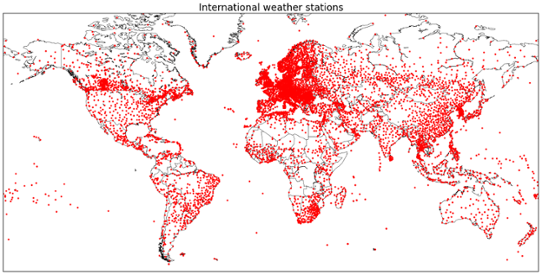
Weather stations utilized in the project
Similar project with Volvo
SMHI supported Volvo in a similar project in 2015, developing temperature statistics for cooling systems in the vehicles produced and sold internationally. Volvo's interest was to see where in the world temperatures exceed a certain temperature criteria under a specified time period. The climate in various places on earth depends on a variety of factors. Important factors are latitude and altitude, but also ocean currents and precipitation patterns affect the climate. The highest temperatures are measured in dry regions close to the equator.
SMHI produced maps showing the number of hours per year where the temperature was above a threshold value. Weather observations from approximately 12,000 global monitoring stations were used in the project, from both manual and automatic stations. According to WMO’s guidelines, temperature should be measured at two meters height above ground in a radiation protection cage. This is to ensure that the measured air temperature is unaffected by solar radiation. It is most common that measurement sites are placed at airports, but also in other places.
Data for a 15-year period (2000 – 2014) were used to produce the maps, and Volvo was able to subsequently design their cooling systems to be resilient to different climate extremes. In addition, SMHI have been able to continually develop customized services within international climate data analysis – a service that has been put to great use in later projects.