Extreme weather analysis is often used when dimensioning for sensitive equipment or structures that are required to withstand hard weather for a long period of time. This is done to determine the probability of a certain event or a combination of events to occur.
Our consultants within the fields of meteorology, hydrology and oceanography will provide you with the statistical information you need. We can determine which monitoring stations and which statistical method is best suited to address your specific issue.
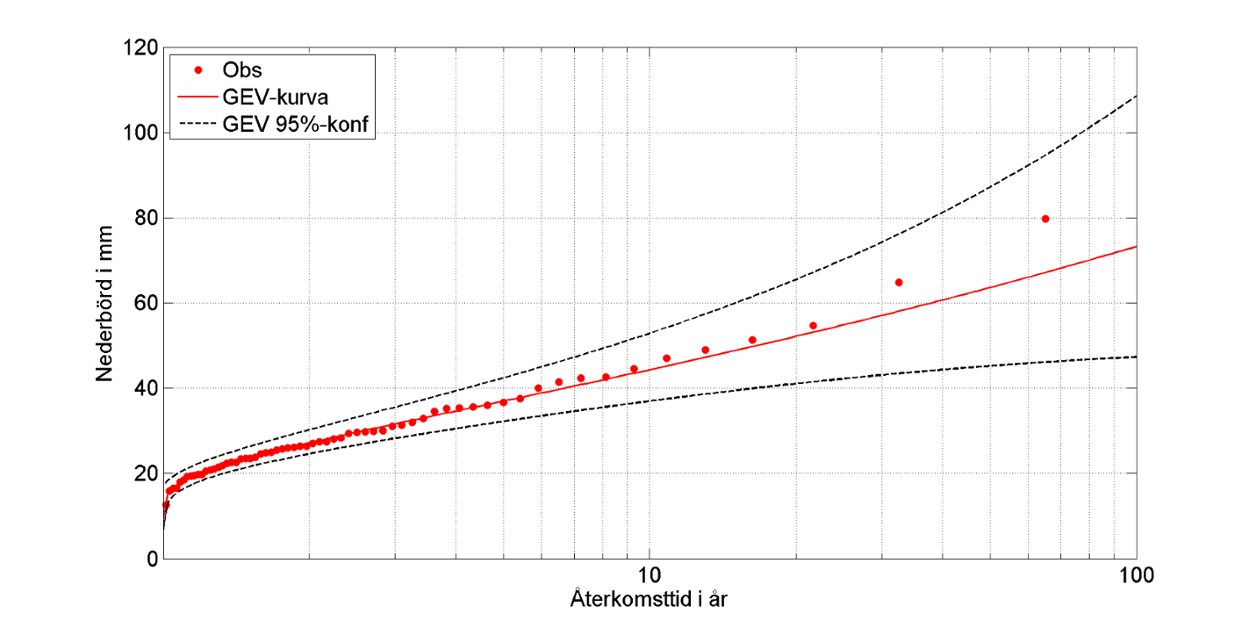
Return period calculation
Return periods can be calculated for all available variables, such as sea level, river discharge, wind speed, maximum and minimum temperature, precipitation and snow depth. The results are presented in a short report complete with diagrams and explanatory texts. The contents of the report can be altered according to your wishes.

In a future climate
Signs of climate change are already starting to show. The global mean temperature is rising, sea levels are increasing and precipitation patterns are changing. We can add a comment in the report on how global warming is expected to affect return periods in the future.
About return periods, probability and risk
A 100-year value has a return period of 100 years. It is on average reached or exceeded one time every 100 years. This means that the probability for this event to happen is 1% for each individual year. Since you are exposed to the risk over a number of years, the accumulated risk is much greater.
For a structure whose life span is expected to be 100 years, the accumulated risk that the 100-year value is exceeded at some point during 100 years amounts to 63%. Another way to put it is to say that it is more probable that the 100-year value will be exceeded than that it will not, if this safety level is selected.
A table with the accumulated risk that a weather event with a certain return period occurs during a certain period of time is to be found in the right hand column.