
Climate research and development
Rossby Centre is involved in national and international projects on climate modelling and research, and on the application of climate information for decision-making for adaptation as well as for measures that limit climate effects.
The research at Rossby Centre aims to increase knowledge about the future climate with a focus on societal benefits. It includes climatological, meteorological, oceanographic and hydrological aspects. The work includes a chain of activities with model development, climate simulations and evaluation of data for climate studies and climate services at SMHI, in Sweden and in Europe, climate information, as well as application of model data for impact and adaptation studies. Rossby Centre participates in national and international projects in climate modelling, climate research and the application of climate information.
Facts and knowledge from our research are used in decisions on measures to limit climate-change emissions to reduce negative climate effects and consequences for society and the natural environment, and to plan and adapt society to a new, changed climate in due time.
Find on this page
Within the Rossby Centre there are five strategically important research areas that cover signicifant aspects of climate research:


Satellite-Driven Predictions and Projections of Scandinavian Heatwaves (ScanHeat)
Heatwaves in Scandinavia are becoming more frequent and intense, posing increasing risks to health, ecosystems, infrastructure, and key economic sectors such as agriculture and forestry. The ScanHeat project aims to improve both future climate projections and seasonal forecasts of Scandinavian heatwaves by combining sa...Precilience
Precilience is a Horizon Europe project developing climate adaptation solutions for the agriculture and forestry sectors in the boreal regions of Denmark, Estonia, Finland, Norway and Sweden.Exploring the transformative potential of climate services
In the research project “Exploring the Transformative Potential of Climate Services,” SMHI researchers will collaborate with a group of researchers from Tema M - Environmental Change and Media and Information Technology at Linköping University to address the future of climate services.SEACLIM
SEACLIM (European SEAs CLIMate impact prediction through regional models) aim to forecast the future of our regional seas, with decadal predictions and long-term climate projections.AI4PEX
AI4PEX, Artificial Intelligence for enhanced representation of processes and extremes in Earth System Models, is a research project that will deliver enhanced knowledge on the Earth system by integrating Earth observations, artificial intelligence, and machine learning into Earth system modelling and analysis.
Rossby Centre develops three-dimensional numerical models of the climate system. The models are based on mathematical descriptions of the physical interaction between processes in the climate system, and describes the interplay between atmosphere, sea, land and ice. The climate models are verified against observations of the climate up to today. The researchers also calculate how robust and reliable the results are with different assumptions about future greenhouse gas emissions, in order to increase the usefulness of the results.
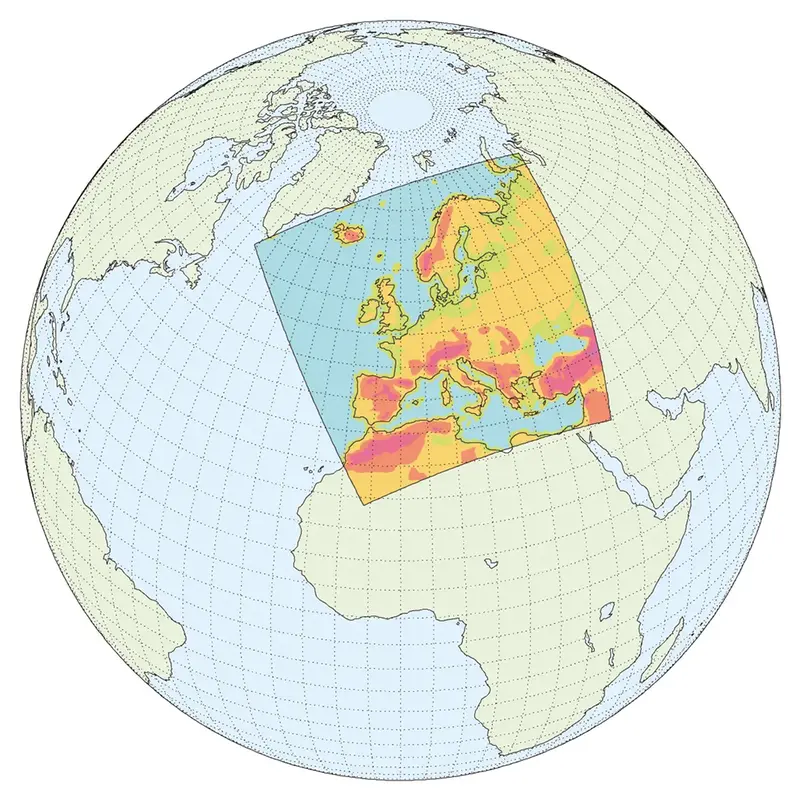
Climate scenarios are produced with both global and regional climate models and are differently detailed at global, regional and local level. The climate scenarios can be used as a basis for society beneficial decisions and for further research.
The current regional climate model at Rossby Centre is HARMONIE-Climate, HCLIM, which is used for detailed climate scenarios. These include extreme events much more realistic than was possible in previous models. HCLIM will be expanded with coupled versions with ocean models and vegetation processes. The regional atmospheric model RCA is about to be phased out.
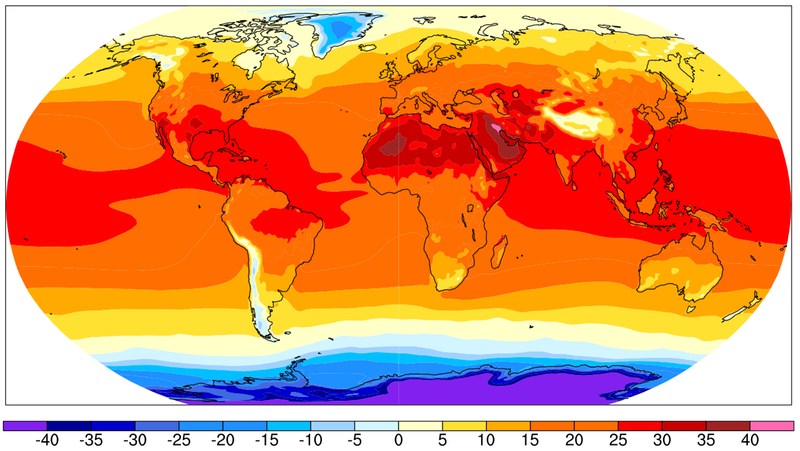
Rossby Centre has developed a global climate model EC-Earth3, which is used for international projects on global warming. Data and results from EC-Earth3 are included in the research that forms the basis for the conclusions presented in the latest report from the UN Climate Panel IPCC AR6. A new global climate system model, EC-EARTH4, is being developed in collaboration with a consortium of European weather services and universities and the European Centre for Medium Range Weather Forecasts.
Rossby Centre thus delivers climate knowledge, data and information as a scientific basis for decisions. This is done in collaboration with other groups within SMHI and in national and international projects.
Contact us at the Rossby Centre
The unit is led by Helena Martins, together with Ralf Döscher and Torben Koenigk.


Rossby Centre arranges the Swedish Climate Symposium

We publish our research in international peer-reviewed journals and in SMHI reports. The two most recent publications are shown below.
CMIP7 data request
Alex C. Ruane, Charlotte L. Pascoe, Claas Teichmann, David J. Brayshaw, Carlo Buontempo, Ibrahima Diouf, Jesus Fernandez, Paula L. M. Gonzalez, Birgit Hassler, Vanessa Hernaman, Ulas Im, Doroteaciro Iovino, Martin Juckes, Irene Lake, Timothy Lam, Xiaomao Lin, Jiafu Mao, Negin Nazarian, Sylvie Parey, Indrani Roy, Wan-Ling Tseng, Briony Turner, Andrew Wiebe, Lei Zhao, Damaris Zurell
Miocene Ocean Gyre Circulation and Gateway Transports-MioMIP1 Ocean Intercomparison
Trusha J. Naik, Agatha M. De Boer, Helen K. Coxall, Natalie J. Burls, Catherine D. Bradshaw, Yannick Donnadieu, Alexander Farnsworth, Amanda Frigola, Matthew Huber, Pasha Karami, Gregor Knorr, Allegra N. Legrande, Yousheng Li, Gerrit Lohmann, Daniel J. Lunt, Matthias Prange, Yurui Zhang
Report from conference in Vietnam highlights the need for robust climate information
Vietnam offered both storms and flooding when the “Asia Climate Risk and Impact Strategic Workshop” was held in Quy Nhon in late November. SMHI co-organised the workshop with the aim of beginning to outline proposals for pilot projects to strengthen interdisciplinary climate collaboration and knowledge exchange across ...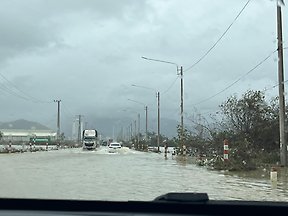
Digital Twin to Help Cities Brace for Extreme Weather
When a sudden cloudburst floods a neighborhood or a heatwave lingers for days, the impact is felt locally, not just on a regional map. Yet until now, decision-makers have lacked tools to understand what extreme weather really looks like at the urban scale. A new research project, Urban Extreme Climate Adaptation Digita...
SMHI leads new research project on future Scandinavian heatwaves
Heatwaves are becoming more frequent and severe across northern Europe, affecting public health, agriculture, forestry, and energy production. A new SMHI-led research project will combine satellite observations, climate modelling and artificial intelligence to strengthen both seasonal forecasts and multidecadal project...