SMHI contributes to improved air quality services in the CAMS consortium
SMHI participates together with several other partners in the CAMS – Copernicus Atmosphere Monitoring Service – consortium, providing and developing air quality products over Europe. You can visit the online service to see air quality forecasts for several pollutants.
With its in-house built chemical transport model MATCH, SMHI contributes in providing and developing the CAMS products over Europe, which is also known as the regional air quality production system. This system comprises 11 models coming from different institutions all over Europe.
CAMS stand for Copernicus Atmosphere Monitoring Service.
As a service, CAMS has several products in its portfolio including satellite measurements of some of the components in the atmosphere, and model results of the atmospheric composition both over the globe and in Europe.

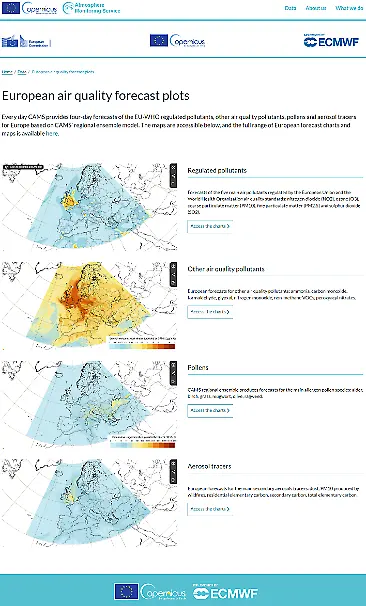
The CAMS website serves the users with forecasts of several air quality parameters. At the CAMS web site, you can explore four-day forecasts of the EU-WHO regulated pollutants, other air quality pollutants, pollens and aerosol tracers for Europe based on CAMS’ regional ensemble model.Illustration atmosphere.copernicus.eu
Daily air quality forecasts of pollutants
Each model in CAMS delivers the forecast of concentrations of several pollutants, examples are ozone, nitrogen monoxide and dioxide, sulphur dioxide, particulate matter, and pollen from different tree species according to their season.
Every day, each partner calculates concentration fields that result from a mathematical combination between the model results and the surface measurements of the respective atmospheric component which is called analysis.
The reanalysis is a similar product that lags two years after the actual measurements, due to the validation process held by the member states. Having the best information from the models and the observations, the reanalysis can be used as a consistent time series for air pollutants trend analysis, i. e. , how concentrations of a certain pollutant evolve in time, and can also point to missing processes in the model, as examples of applications.
The better result of each of these three products is the Ensemble of the 11 models because it shows consistently a lower error than each model individually, and also allows us to have information on how uncertain they are.
The information is updated on the CAMS web site according to the frequency of the products, which can be seen in the form of graphs and maps.

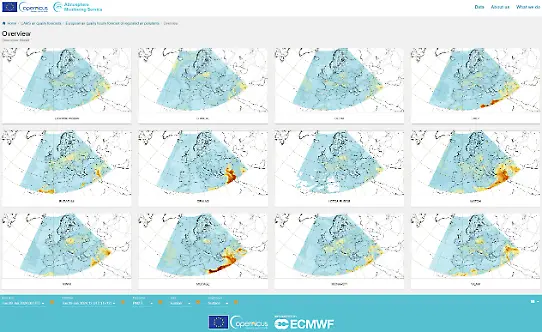
Example of forecast of PM2.5 in Europe valid for the 9th of January 12UTC 2024 (run started on the 9th of January 2022 at 00UTC).Illustration atmosphere.copernicus.eu


