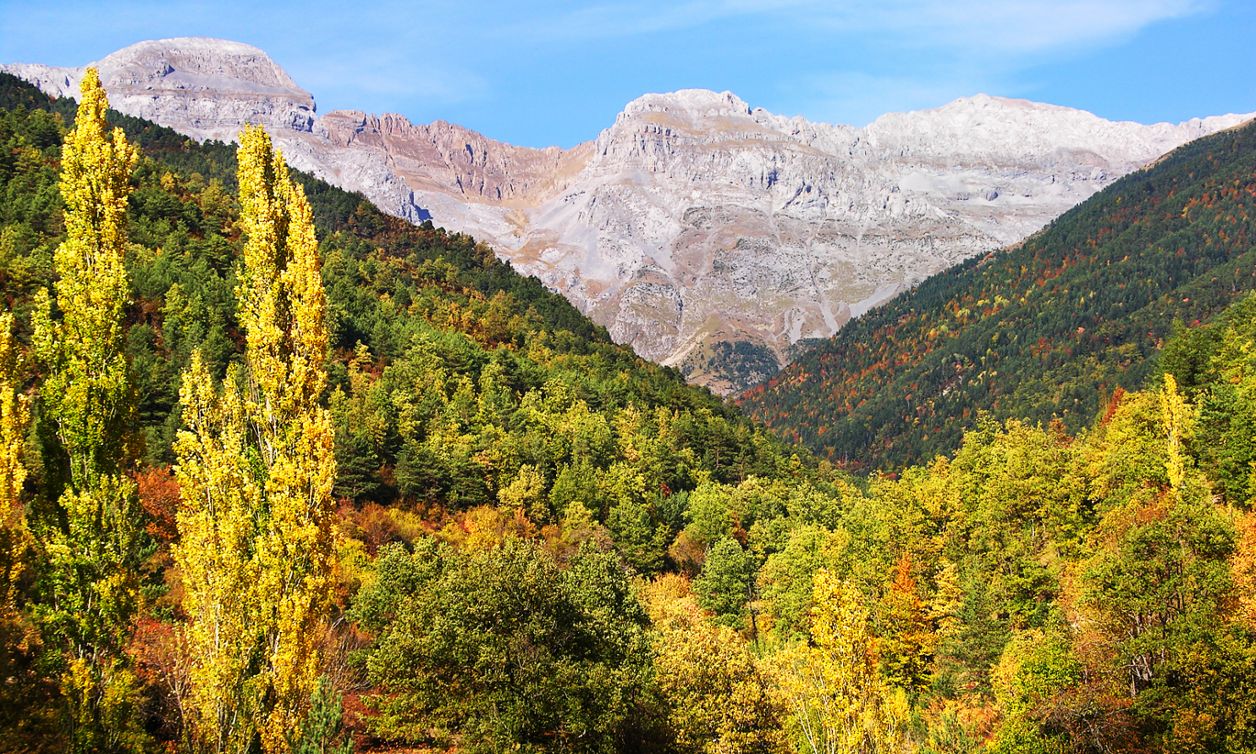
With around 130 peaks exceeding 3000 m in altitude the Pyrenees Mountains represent a natural border between France and Spain. The range is more than 450 km long and ~100 km wide, spanning in a west-east direction from the Atlantic Ocean to the Mediterranean Sea. The Pyrenees' biodiversity is rich and unique, with more than 4500 vascular plant species and 180 endemic species. The Pyrenees is one of the European plant biodiversity centers, threatened by climate change.
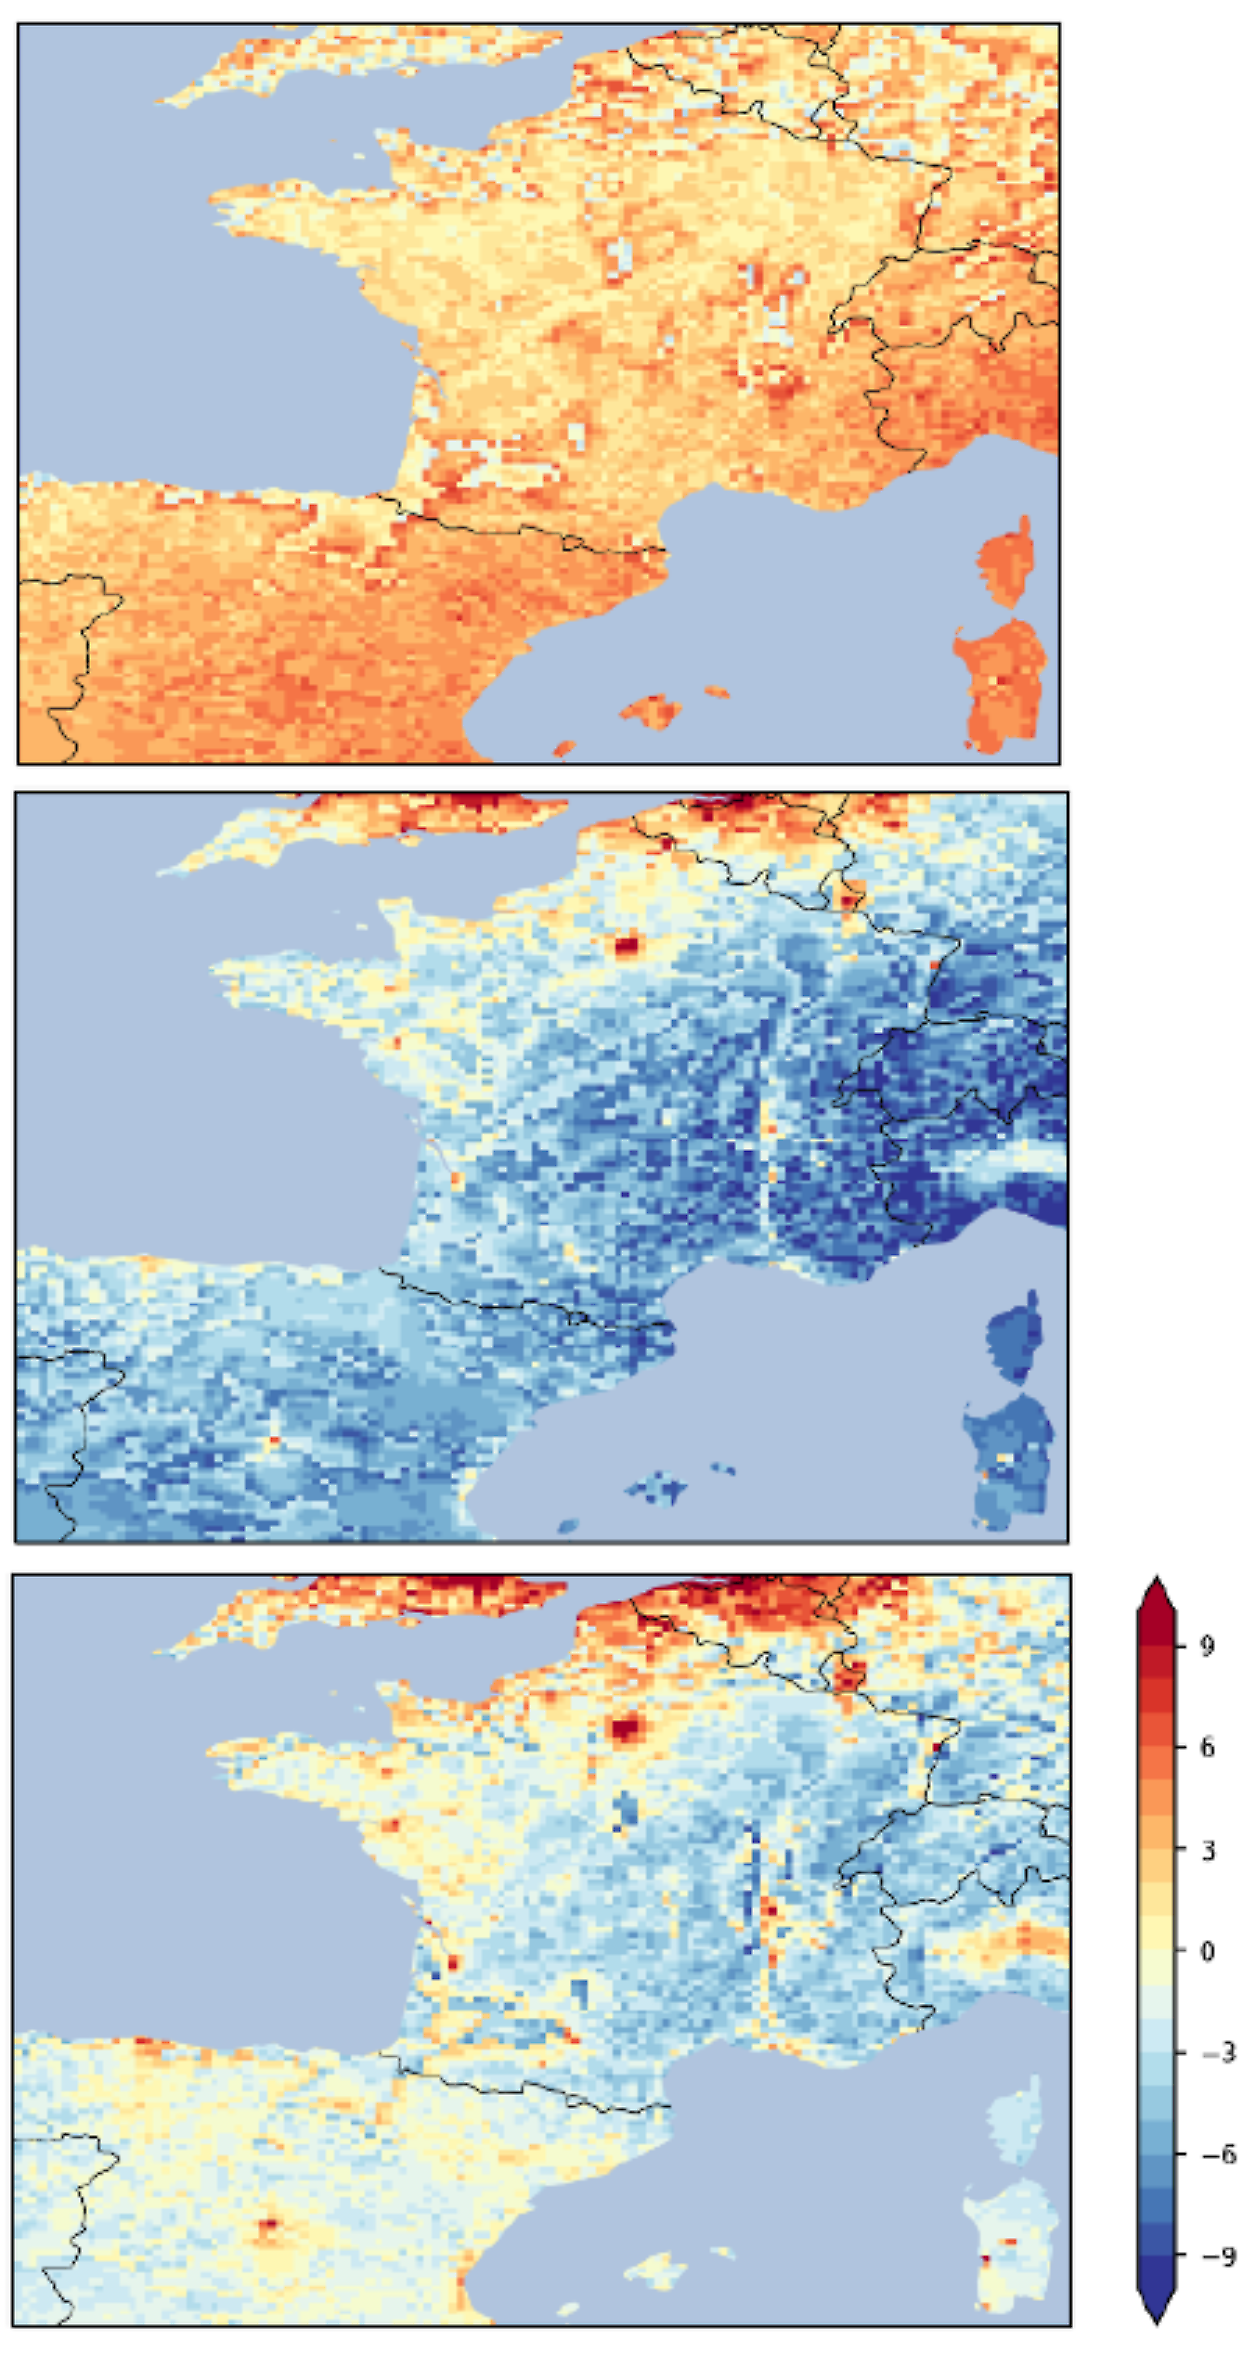
According to our new climate simulations, the warming effect in France is more marked in mountain areas (the Alps and the Pyrenees). Here, the average temperature change will exceed 2°C by the middle of the century under a scenario with strong future growth in greenhouse gas emissions (RCP8.5). Climate change has strong geographic variations with 20% less precipitation on the Mediterranean side and 20% more on the Atlantic side, when comparing two extended periods for the past (1961-1991) and the future (2041-2051). It is important to note that this is based on one climate scenario only.
The performance of CHIMERE for near-surface ozone concentrations was evaluated by comparison with measured concentrations in the European Environmental Agency (EEA) network. The seasonal cycle in measured concentrations over Europe is rather well reproduced with a low average bias over the Pyrenean region (around 1 μg/m3).
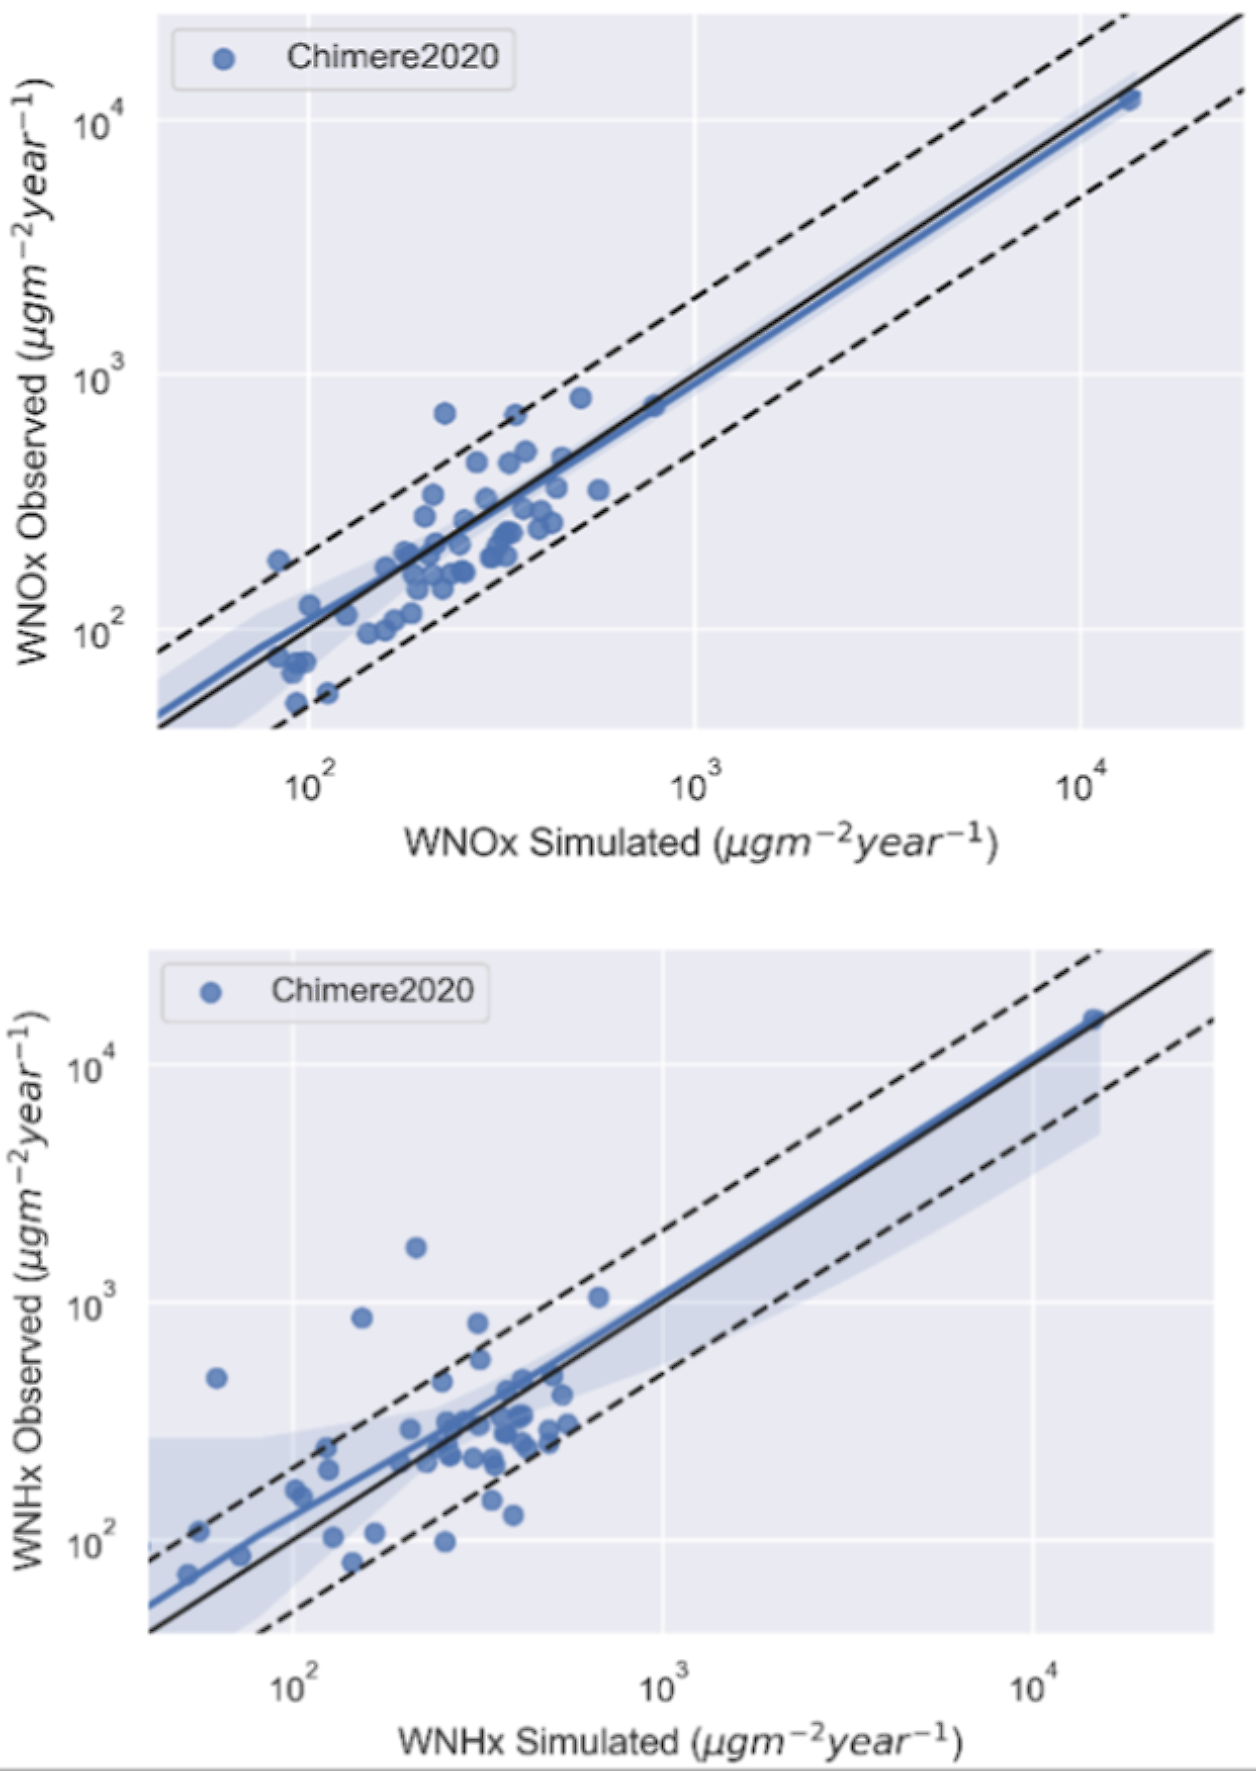
The wet deposition of reduced and oxidized nitrogen was evaluated by comparison with measurements over Europe from the EMEP (European Monitoring and Evaluation Programme) network retrieved from the EBAS database with atmospheric measurement data. The model manages to reproduce the order of magnitude of wet deposition (within a factor 2 except for a small number of stations).
Our results indicate a climate penalty in near surface ozone annual concentration, whereas we found no clear climate penalty of climate change on nitrogen deposition and AOT40. The effect of climate change on annual mean ozone can be compensated by emission mitigation as the concentrations are estimated to slowly decrease when also accounting for emission change. For nitrogen deposition, over all of the domain, the evolution of nitrogen deposition is dominated by the effect of emission mitigation with a decrease around 300 µg-N/m² over the Pyrenees until mid-century. Thus, the decreased ozone and nitrogen loads by mid-century are relying on continued efforts to decrease anthropogenic emissions.
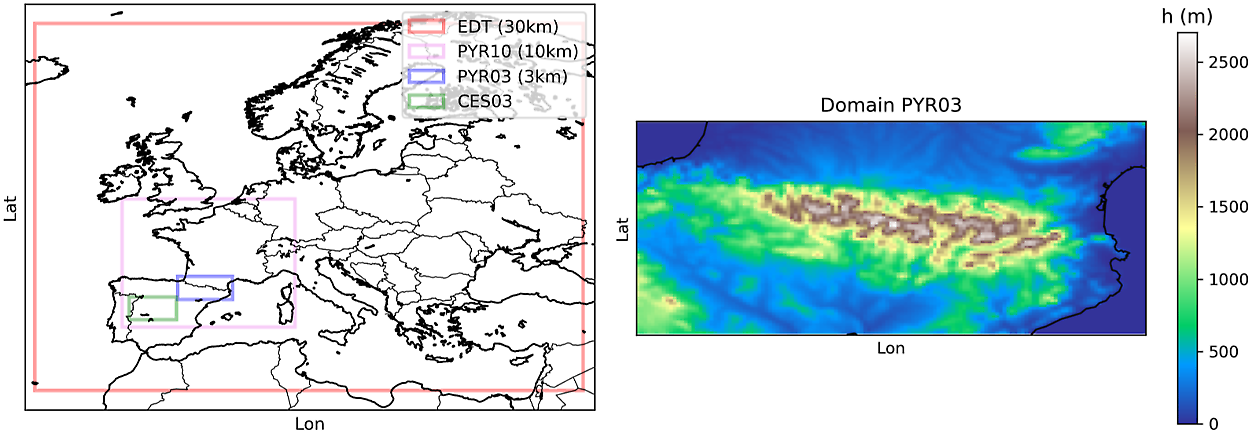
This was simulated by the CHIMERE model, using meteorology from a climate model based on RCP8.5 for current (1996-2005) and future (2041-2050), with current (ECLIPSE V6b, 2005) and future emissions (ECLIPSE V6b, 2050 current legislation). For isolation of potential climate penalty, 2005 emissions were used in the model simulation based on future climate.
Climate change will probably impact plant communities across the entire Pyrenees Mountains, caused by vegetation zones climbing higher up in altitude. This may result in reduced habitat available for species adapted to the higher altitude. Air quality has the potential to be improved more rapidly compared with climate change, at least partly due to the shorter lifetime of air pollutant species. Thus, mitigation of air pollutant emissions should be continued, as these have the potential to decreasing the overall load on mountain ecosystems such as the Pyrenees.